Newsroom
- IR
Q3 FY2020 Financial Results
Feb 15, 2021
TOKYO, JAPAN (Feb. 15, 2021) - Recruit Holdings Co., Ltd. ("Recruit Holdings" or the "Company") today announced financial results for the nine months ended December 31, 2020 (unaudited).
Consolidated revenue of 1,656.1 billion yen (-8.5%), revenue excluding the Rent Assistance Program was 1,596.0 billion yen (-11.8%), adjusted EBITDA of 210.9 billion yen (-21.8%), adjusted EPS of 75.78 yen (-26.9%).
Business environment gradually improved sequentially from Q2.
Reduced SG&A expenses by 16.8 billion yen yoy driven mainly by reduced advertising expenses and promotion expenses, as well as lower sales commissions which were directly correlated to revenue.
(In billions of yen, unless otherwise stated)
| FY2020 | ||||
|---|---|---|---|---|
| Q3 | YoY | 9M | YoY | |
| Revenue*¹ | 611.5 | 0.5% | 1,656.1 | -8.5% |
| Revenue (ex Rent Assistance Program) | 580.9 | -4.5% | 1,596.0 | -11.8% |
| Adjusted EBITDA | 87.5 | -5.0% | 210.9 | -21.8% |
| Adjusted EBITDA margin | 14.3% | -0.8 pt | 12.7% | -2.2 pt |
| Operating income | 68.5 | -1.5% | 143.3 | -32.5% |
| Profit attributable to owners of the parent | 55.0 | 5.1% | 117.5 | -29.4% |
| Adjusted EPS | 33.95 yen | -4.9% | 75.78 yen | -26.9% |
*1 Revenue for the three months and nine months ended December 31, 2020 includes 30.6 billion yen and 60.1 billion yen respectively from the Rent Assistance Program.
2. Q3 FY2020 Segment Highlights
HR Technology:
Revenue increased by 4.6% yoy and by 8.8%*¹ yoy in US dollar terms. Revenue increase was primarily driven by increased demand yoy for sponsored job advertising.
Adjusted EBITDA increased by 40.0% yoy, primarily driven by an increase in revenue and decreased sales, marketing and administrative costs. Adjusted EBITDA margin was 23.4% (17.5% in Q3 FY2019).
Increased marketing investments compared to Q2 FY2020 and continued to hire engineers and technical employees as revenue trends continued to improve.
*1 The US dollar based revenue reporting represents the financial results of operating companies in this segment on a US dollar basis, which differ from the consolidated financial results of the Company.
Media & Solutions:
Revenue increased by 1.1% (-15.5% ex revenue from the Rent Assistance Program) yoy. Although revenue continued to slowly recover in Q3 extending the gradual recovery experienced in Q2 and revenue growth rates improved qoq, revenue for both Marketing Solutions and HR Solutions decreased yoy excluding revenue from the Rent Assistance Program.
Adjusted EBITDA decreased by 25.2% yoy. Adjusted EBITDA margin was 20.2%
Both Marketing Solutions and HR Solutions partially resumed marketing investments in an attempt to capture demand during an anticipated period of recovery. At the same time, Media & Solutions continuously reduced overall advertising costs and managed its operating expenses strategically and flexibly.
Staffing:
Revenue decreased by 1.2% (-1.7% ex FX impact) yoy. Revenue for Japan operations decreased by 2.6% and for Overseas operations increased by 0.1% (-1.0% ex FX impact) yoy.
Adjusted EBITDA increased by 3.0% (Japan +3.3%, Overseas +2.5%) yoy. Adjusted EBITDA margin was 7.8%.
For Japan operations, revenue decreased primarily due to lower demand for temporary staff amid the economic uncertainty, while adjusted EBITDA increased mainly due to ongoing cost control measures.
For Overseas operations, both revenue and adjusted EBITDA increased yoy, primarily due to strong revenue growth in certain industries as well as positive impact of FX movements. Overseas operations maintained a positive adjusted EBITDA margin through ongoing cost control initiatives.
Revenue
(In billions of yen)
| Q3 | 9M | |||||
|---|---|---|---|---|---|---|
| FY2019 | FY2020 | YoY | FY2019 | FY2020 | YoY | |
| Consolidated Revenue*² | 608.5 | 611.5 | 0.5% | 1,809.7 | 1,656.1 | -8.5% |
| HR Technology | 109.5 | 114.5 | 4.6% | 318.5 | 292.1 | -8.3% |
| Revenue in US dollars*¹ (In millions of US dollars) |
$1,007 | $1,095 | 8.8% | $2,932 | $2,758 | -5.9% |
| Media & Solutions | 184.8 | 186.8 | 1.1% | 563.0 | 492.6 | -12.5% |
| Marketing Solutions | 109.1 | 134.0 | 22.8% | 325.5 | 334.9 | 2.9% |
| Housing & Real Estate | 28.4 | 29.8 | 5.2% | 82.7 | 84.1 | 1.7% |
| Beauty | 20.7 | 21.3 | 2.7% | 60.4 | 59.4 | -1.6% |
| Bridal | 13.3 | 8.0 | -39.8% | 39.8 | 22.4 | -43.6% |
| Travel | 17.7 | 20.1 | 13.9% | 56.5 | 41.9 | -25.8% |
| Dining | 10.4 | 5.4 | -48.5% | 29.3 | 10.3 | -64.9% |
| Others | 18.4 | 49.2 | 167.3% | 56.5 | 116.6 | 106.2% |
| HR Solutions | 74.6 | 52.1 | -30.1% | 234.9 | 155.8 | -33.7% |
| Recruiting in Japan | 65.8 | 45.1 | -31.5% | 207.8 | 136.2 | -34.5% |
| Others | 8.7 | 6.9 | -19.9% | 27.1 | 19.6 | -27.8% |
| Eliminations and Adjustments | 1.0 | 0.5 | - | 2.5 | 1.8 | - |
| Staffing | 320.3 | 316.6 | -1.2% | 950.4 | 889.4 | -6.4% |
| Japan | 146.5 | 142.7 | -2.6% | 424.1 | 427.4 | 0.8% |
| Overseas | 173.7 | 173.9 | 0.1% | 526.3 | 462.0 | -12.2% |
| Eliminations and Adjustments | (6.2) | (6.4) | - | (22.3) | (18.0) | - |
Adjusted EBITDA
(In billions of yen)
| Q3 | 9M | |||||
|---|---|---|---|---|---|---|
| FY2019 | FY2020 | YoY | FY2019 | FY2020 | YoY | |
| Consolidated Adjusted EBITDA*² | 92.1 | 87.5 | -5.0% | 269.8 | 210.9 | -21.8% |
| HR Technology | 19.1 | 26.7 | 40.0% | 62.8 | 49.3 | -21.4% |
| Media & Solutions | 50.5 | 37.8 | -25.2% | 148.6 | 99.5 | -33.1% |
| Marketing Solutions | 35.2 | 35.6 | 1.1% | 97.3 | 83.6 | -14.1% |
| HR Solutions | 19.7 | 8.3 | -57.7% | 64.6 | 32.1 | -50.3% |
| Eliminations and Adjustments | (4.4) | (6.1) | - | (13.3) | (16.2) | - |
| Staffing | 24.1 | 24.8 | 3.0% | 65.0 | 67.1 | 3.2% |
| Japan | 13.6 | 14.1 | 3.3% | 36.9 | 44.9 | 21.9% |
| Overseas | 10.4 | 10.6 | 2.5% | 28.1 | 22.1 | -21.2% |
| Eliminations and Adjustments | (1.6) | (1.9) | - | (6.6) | (5.1) | - |
Adjusted EBITDA Margin |
||||||
| Consolidated Adjusted EBITDA Margin | 15.1% | 14.3% | -0.8pt | 14.9% | 12.7% | -2.2pt |
| HR Technology | 17.5% | 23.4% | +5.9pt | 19.7% | 16.9% | -2.8pt |
| Media & Solutions | 27.4% | 20.2% | -7.1pt | 26.4% | 20.2% | -6.2pt |
| Marketing Solutions | 32.3% | 26.6% | -5.7pt | 29.9% | 25.0% | -4.9pt |
| HR Solutions | 26.4% | 16.0% | -10.4pt | 27.5% | 20.6% | -6.9pt |
| Staffing | 7.5% | 7.8% | +0.3pt | 6.8% | 7.6% | +0.7pt |
| Japan | 9.3% | 9.9% | +0.6pt | 8.7% | 10.5% | +1.8pt |
| Overseas | 6.0% | 6.1% | +0.1pt | 5.4% | 4.8% | -0.5pt |
*1 The US dollar based revenue reporting represents the financial results of operating companies in this segment on a US dollar basis, which differ from the consolidated financial results of the Company.
*2 The total sum of the three segments does not correspond with consolidated numbers due to Eliminations and Adjustments, such as intra-group transactions.
3. Consolidated Financial Guidance for FY2020
The Company has determined it is appropriate to revise the consolidated financial guidance for FY2020 in order to reflect the results of Q3 FY2020, and its revised outlook for Q4 FY2020.
Despite the gradual recovery in Q3 FY2020, the Company expects a challenging business environment in Q4 FY2020, mainly due to the state of emergency in Japan which is applied to Tokyo and 10 other prefectures in January 2021, as well as certain restrictions and lockdowns in the US and Europe being reinforced from the latter half of Q3 FY2020.
The Company has also revised its outlook for each SBU and updated its outlook for other operating income and expenses. Please refer to the following for the details.
Consolidated revenue for the six months ending March 31, 2021 is expected to be approximately 1.18 trillion yen, and is expected to be approximately 2.22 trillion yen for FY2020.
Consolidated adjusted EBITDA for the six months ending March 31, 2021 is expected to be approximately 108.5 billion yen, and is expected to be approximately 231.9 billion yen for FY2020.
Adjusted EPS for FY2020 is expected to be approximately 77.08 yen, assuming the amount of depreciation and amortization and other adjustment items for the six months ending March 31, 2021 to be similar to the six months ended September 30, 2020.
Assumptions of FX rates for the consolidated financial guidance for FY2020 are as follows: 107 yen per US dollar, 121 yen per Euro, 74 yen per Australian dollar.
4. Segment Financial Guidance for FY2020
HR Technology
Revenue for HR Technology, on a US dollar basis, for the six months ending March 31, 2021 is expected to increase approximately 11% yoy. HR Technology expects the rebound of recruiting and hiring activity and improving revenue trends seen in Q3 to continue in Q4, assuming the business environment does not deteriorate significantly.
Adjusted EBITDA margin for the six months ending March 31, 2021 for HR Technology is expected to be in the high-teens.
In order to continue to improve its revenue trend globally in the short-term and to accelerate revenue growth in the mid-term, HR Technology plans to invest in sales and marketing activities to acquire new users and clients, and in product enhancements to increase user and client engagement.
Media & Solutions
Revenue for Marketing Solutions, excluding the Rent Assistance Program, for the six months ending March 31, 2021, is expected to decrease approximately 11% yoy. Including the Rent Assistance Program, revenue for the same period is expected to increase approximately 12% yoy.
For Q4, continued stable performance is expected for Beauty, while revenue of Travel is expected to decrease yoy due to the suspension of the Go To Travel campaign.
The challenging business environment is expected to continue for Bridal and Dining. Housing & Real Estate is expected to be weaker in Q4 due to a decrease of the number of properties available for sale.
Revenue for HR Solutions for the six months ending March 31, 2021 is expected to decrease approximately 28% yoy, mainly due to weak hiring demand for the part-time workers, which was negatively impacted by the state of emergency in Japan. The placement service also has seen recent signs of gradual recovery but due to its pay-per-hire model, revenue from recovered demand will be realized sometime in next fiscal year.
Adjusted EBITDA margin for the six months ending March 31, 2021 for Media & Solutions is expected to be approximately 12%. Media & Solutions expects to continue reducing operating expenses such as advertising, while resuming strategic marketing investments targeted at the anticipated period of recovery.
Revenue from the Rent Assistance Program, which is recorded in Others under Marketing Solutions in Media & Solutions for FY2020 is expected to be 93.2 billion yen including tax. However, the total revenue recorded in FY2020 may be lower depending on the number of applicants and recipients of the program.
Staffing
Revenue for Japan operations for the six months ending March 31, 2021 is expected to decrease approximately 2.5% yoy mainly due to weak demand for new orders.
Revenue for Overseas operations for the same period is expected to decrease approximately 1.5%.
Adjusted EBITDA margin for the six months ending March 31, 2021 for Staffing is expected to be approximately 5% primarily due to the expected decline in revenue, the expenses to improve remote work environments and an increase in advertising expenses to attract temporary staff and business clients mainly in Japan, partially offset by continued cost control measures.
5.FAQ's
Consolidated Financial Guidance and Dividend Forecasts for FY2020
Q1:
What are the reasons behind the revision of FY2020 consolidated financial guidance announced on November 16, 2020? Is there a change in the dividend forecast?
A1:
The Company has determined it is appropriate to revise the consolidated financial guidance for FY2020 in order to reflect the results of Q3 FY2020, and its revised outlook for Q4 FY2020. Previous guidance was based on the assumption that the business environment would not deteriorate significantly compared to Q2 FY2020 during the remainder of the fiscal year. However, despite the gradual recovery in Q3 FY2020, the Company expects a challenging business environment in Q4 FY2020, mainly due to the state of emergency in Japan which is applied to Tokyo and 10 other prefectures in January 2021, as well as certain restrictions and lockdowns in the US and Europe being reinforced from the latter half of Q3 FY2020. The Company has also revised its outlook for each SBU (Strategic Business Unit) and updated its outlook for other operating income and expenses. Please refer to the following for the details.
There is no change in the dividend forecast. Assumptions of the foreign exchange rates for the consolidated financial guidance for FY2020 also remain the same as follows: 107 yen per US dollar, 121 yen per Euro, 74 yen per Australian dollar.
| Guidance for six months ending March 31, 2021 | Guidance for twelve months ending March 31, 2021 | |||||||
|---|---|---|---|---|---|---|---|---|
| Updated guidance | Year on year % change | Previous guidance | Year on year % change | Updated guidance | Year on year % change | Previous guidance | Year on year % change | |
| Revenue | 1,180.0 | -1.5% | 1,105.0 - 1,200.0 |
-7.8% - 0.1% |
2,224.6 | -7.3% | 2,149.6 - 2,244.6 |
-10.4% - -6.5% |
| Adjusted EBITDA | 108.5 | -26.4% | 86.6 - 121.6 |
-41.2% - -17.5% |
231.9 | -28.7% | 210.0 - 245.0 |
-35.4% - -24.6% |
| Operating income | 76.5 | 20.8% | 37.0 - 72.0 |
-41.6% - 13.7% |
151.2 | -26.6% | 111.7 - 146.7 |
-45.8% - -28.8% |
| Profit before tax | 77.5 | 13.4% | 37.5 - 72.5 |
-45.1% - 6.1% |
155.9 | -31.0% | 115.9 - 150.9 |
-48.7% - -33.2% |
| Profit for the period | 60.5 | -8.8% | 31.0 - 56.0 |
-53.2% - -15.5% |
123.6 | -31.8% | 94.1 - 119.1 |
-48.1% - -34.3% |
| Profit attributable to owners of the parent | 61.0 | -7.2% | 30.5 - 55.7 |
-53.6% - -15.2% |
123.5 | -31.3% | 93.0 - 118.2 |
-48.3% - -34.2% |
| Adjusted EPS (yen) | 35.25 | -33.6% | 21.00 - 36.00 |
-60.4% - -32.2% |
77.08 | -36.3% | 62.83 - 77.83 |
-48.1% - -35.7% |
Q2:
What are the changes to the SBU level financial guidance for the second half of FY2020?
A2:
The revised guidance for the second half of FY2020 for the three segments is provided below. For Marketing Solutions in Media & Solutions, the figures in the upper row of revenue guidance exclude revenue from the Rent Assistance Program by The Small and Medium Enterprise Agency of the Ministry of Economy in Japan ("Rent Assistance Program"), and the figures in the lower row include it.
| (In billions of yen, unless otherwise stated) |
Updated guidance for 2H FY2020 |
Previous guidance for 2H FY2020 |
||
|---|---|---|---|---|
| HR Technology |
Revenue (million US dollars) |
approx. +11% yoy on a USD basis |
approx. -5% - +9% yoy on a USD basis |
|
| Adjusted EBITDA margin |
High-teens % | Mid-teens % | ||
| Media & Solutions | Revenue | Marketing Solutions | approx. -11% yoy (approx. +12% yoy) |
approx. -9% - +6% yoy (approx. +15% - +30% yoy) |
| HR Solutions | approx. -28% yoy | approx. -25% yoy | ||
| Adjusted EBITDA margin |
approx. 12% | approx. 12% | ||
| Staffing | Revenue | Japan | approx. -2.5% yoy | approx. -10% - -5% yoy |
| Overseas | approx. -1.5% yoy | approx. -12% - -8% yoy | ||
| Adjusted EBITDA margin |
approx. 5% | approx. 5% | ||
Consolidated Results
Q3:
Has the Company continued to control operating expenses, including advertising?
A3:
In Q3 FY2020 selling, general and administrative expenses decreased 6.6% to 238.8 billion yen, a decrease of 16.8 billion yen year on year. The decrease was driven by lower advertising expenses across all three segments, declining 9.3% year on year to 34.3 billion yen, a reduction of 3.5 billion yen. However, compared to Q2 FY2020, advertising expenses increased in HR Technology and a few subsegments in Media & Solutions where the business environment improved. In addition, reductions in promotion expenses and revenue-based sales commissions contributed to the year on year decrease in SG&A expenses. However, these increased quarter on quarter due to improving revenue trends in some businesses.
Q4:
How have revenue and adjusted EBITDA for consolidated and each SBU been trending since Q4 FY2019?
| (In billions of yen, unless otherwise stated) | FY2019 | FY2020 | ||||
|---|---|---|---|---|---|---|
| Q4 | Q1 | Q2 | Q3 | |||
| Consolidated | Revenue | 589.7 | 475.4 | 569.1 | 611.5 | |
| YoY % change | 1.6% | -20.0% | -6.2% | 0.5% | ||
| Adj. EBITDA | 55.2 | 53.4 | 69.9 | 87.5 | ||
| Adj. EBITDA margin | 9.4% | 11.2% | 12.3% | 14.3% | ||
| HR Technology | Revenue (million US dollars) |
$974 | $689 | $973 | $1,095 | |
| YoY % change | 19.4% | -25.8% | -2.3% | 8.8% | ||
| Revenue | 106.3 | 74.1 | 103.4 | 114.5 | ||
| YoY % change | 18.1% | -27.5% | -3.1% | 4.6% | ||
| Adj. EBITDA | 8.3 | 7.8 | 14.7 | 26.7 | ||
| Adj. EBITDA margin | 7.9% | 10.6% | 14.3% | 23.4% | ||
| Media & Solutions | Marketing Solutions |
Revenue | 113.0 | 77.1 | 123.7 | 134.0 |
| YoY % change | 7.5% | -27.1% | 11.9% | 22.8% | ||
| Adj. EBITDA | 18.6 | 17.2 | 30.7 | 35.6 | ||
| Adj. EBITDA margin | 16.5% | 22.3% | 24.9% | 26.6% | ||
| HR Solutions |
Revenue | 79.1 | 55.1 | 48.5 | 52.1 | |
| YoY % change | -8.6% | -32.1% | -38.7% | -30.1% | ||
| Adj. EBITDA | 18.8 | 14.9 | 8.8 | 8.3 | ||
| Adj. EBITDA margin | 23.7% | 27.1% | 18.3% | 16.0% | ||
| Staffing | Japan | Revenue | 143.6 | 145.8 | 138.8 | 142.7 |
| YoY % change | 7.7% | 5.9% | -0.7% | -2.6% | ||
| Adj. EBITDA | 10.2 | 17.0 | 13.8 | 14.1 | ||
| Adj. EBITDA margin | 7.1% | 11.7% | 9.9% | 9.9% | ||
| Overseas | Revenue | 154.0 | 128.4 | 159.6 | 173.9 | |
| YoY % change | -9.8% | -26.6% | -10.2% | 0.1% | ||
| Adj. EBITDA | 5.9 | 2.8 | 8.6 | 10.6 | ||
| Adj. EBITDA margin | 3.9% | 2.2% | 5.4% | 6.1% | ||
HR Technology
Q5:
The overall labor market has not broadly recovered from the effects of COVID-19. Why did HR Technology revenue increase quarter on quarter and year on year and did you update 2H FY 2020 revenue guidance as a result?
A5:
Revenue for Q3 FY2020 was 114.5 billion yen, an increase of 4.6% year on year. On a US dollar basis, reported revenue increased 8.8% for Q3 FY2020 primarily driven by increased demand year on year for sponsored job advertising as hiring activity continued to improve during the quarter.
During the third quarter, restrictions and measures put in place to limit the spread of COVID-19 remained in effect or were reimposed in certain markets. However, many businesses reopened, new businesses were created, and others expanded their operations to meet shifts in customer demand. This supported a continued rebound of recruiting and hiring activity and improving revenue trends, particularly in the US and especially among SMEs.
While large enterprises in general have been slower to start hiring again in this environment, during the quarter we saw significant hiring demand from a few large companies in e-commerce, logistics, and delivery services in response to the shift in demand for online goods and services. However, it is too early to know how much of this demand was seasonal and how much is due to structural shifts in the economy.
Outside the US the pace and scale of revenue recovery has varied by country. With lockdowns re-imposed in some countries, there was still broad improvement compared to Q2 FY2020. Demand for hiring in aggregate has been relatively slower to recover compared to the US as conditions remain challenging in many countries due to the continued varying impacts of COVID-19 and the responses from employers and governments.
In reaction to these positive trends we have updated guidance for the second half of FY2020 for HR Technology. HR Technology's revenue, on a US dollar basis, for the six months ending March 31, 2021 is expected to increase approximately 11% compared to the same period of the previous year.
However, HR Technology remains cautious regarding the pace and trajectory of continued improvement due to the global spread of COVID-19 and measures to help prevent the spread and how those conditions may affect business client and job seeker activity.
Q6:
Adjusted EBITDA margin in Q3 FY2020 of 23.4% is substantially higher than any quarter since Q2 FY2019. What were the drivers and are you updating your 2H FY2020 adjusted EBITDA margin guidance?
A6:
In Q3 FY2020, adjusted EBITDA increased 40% year on year, primarily driven by an increase in revenue. In this environment, HR Technology continued to focus on value creating product enhancements to simplify hiring processes and significantly reduce the cost and time to hire for employers. However, increased investments in product and technology were offset by lower spending in sales, marketing, and administrative costs year on year.
As revenue trends continued to improve faster than expected, HR Technology ramped up its marketing investments compared to Q2 FY2020, and continued to hire engineers and technical employees to drive product enhancements in support of HR Technology's goal to dramatically simplify recruiting processes and significantly reduce the cost and time to hire for employers. However, due to the uncertain economic environment, HR Technology continued to be conservative in making those investments. As a result, Q3 FY2020 adjusted EBITDA margin was higher year on year and quarter on quarter.
Looking ahead to Q4, as the recovery is expected to continue, HR Technology will continue to ramp up sales and marketing investments significantly and will invest aggressively to accelerate its innovation and leverage its data and insights to make hiring simple and fast. As a result of the improving revenue trends, we have updated guidance for adjusted EBITDA margin for the six months ending March 31, 2021 for HR Technology, which is expected to be in the high teens.
Q7:
What does the latest Hiring Lab job posting data tell me about the current labor market in the US? What does it tell me about HR Technology's revenue performance?
A7:
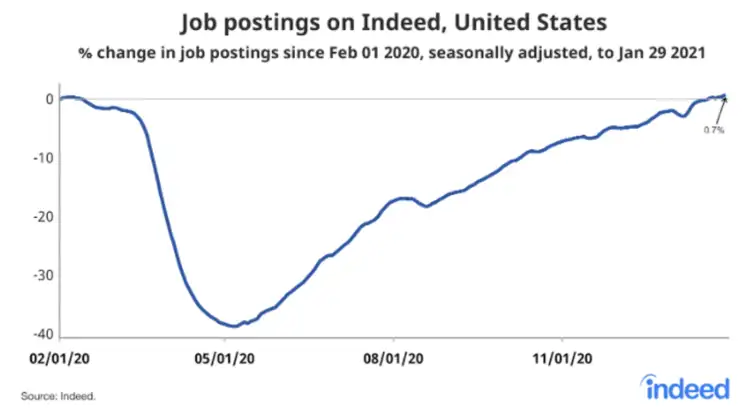
The Hiring Lab changed the methodology for measuring job posting data in January 2021, and now compares job posting volume to a February 1, 2020 pre-pandemic baseline on a seasonally adjusted basis.
Job postings plunged from mid-March to early May 2020, to a low of 39% below the February 1, 2020 pre-pandemic baseline. Then, postings rebounded in May, June, and July by an average of 1.6 percentage points per week. Starting in August, improvement slowed to an average of just 0.7 percentage points per week.
As of January 29, 2021 job postings in the US were 0.7% above February 1, 2020, using a seasonally adjusted 7-day trailing average. For reference, using this methodology, job postings as of November 6, 2020, which were included in the Q2 FY2020 FAQ, were 6.9% below February 1, 2020.
Returning to the February 1, 2020 baseline does not mean the labor market has recovered, however. From February 1, 2019, to February 1, 2020, US job postings increased by 9%, so returning now to the baseline means slower growth than pre-pandemic.
The job postings data analyzed by the Indeed Hiring Lab includes paid and unpaid job posts and is not directly correlated to Indeed sponsored job advertising revenue. Therefore, the growth trend of job postings is not directly correlated to the growth trend of HR Technology revenue.
Media & Solutions
Q8:
Compared to the financial guidance announced on November 16, 2020, are there any changes in the outlook for Marketing Solutions and HR Solutions?
A8:
Revenue for Marketing Solutions, excluding the Rent Assistance Program, for the six months ending March 31, 2021, is expected to decrease approximately 11% year on year. Including the Rent Assistance Program, revenue for the same period is expected to increase approximately 12% year on year. In Marketing Solutions, for Q4 under the state of emergency applied to Tokyo and 91 other prefectures, Beauty is expected to have continued stable performance, while revenue of Travel is expected to decrease year on year again due to the suspension of the Go To Travel campaign. The challenging business environment is expected to continue for Bridal and Dining. Housing & Real Estate has performed steadily in Q2 and Q3, however its performance is expected to be weaker in Q4 as the number of properties which are available for sale has been decreasing.
Revenue for HR Solutions for the six months ending March 31, 2021 is expected to decrease approximately 28% year on year. The part-time job boards have seen recent signs of recovery, however, hiring demand is expected to be negatively impacted, especially in the dining industry, by the state of emergency in Japan. The placement service also has seen recent signs of gradual recovery, but due to its pay-per-hire model, revenue from recovered demand is expected to be realized sometime next fiscal year.
Adjusted EBITDA margin for the six months ending March 31, 2021 for Media & Solutions is expected to be approximately 12%. Media & Solutions expects to continue reducing operating expenses such as advertising, while resuming strategic marketing investments targeted at the anticipated period of recovery.
Q9:
The Go To Travel campaign was suspended on December 28. What impact, if any, did the suspension have on Travel in Q3 FY2020? What are your expectations for Q4 FY2020?
A9:
The suspension of the Go To Travel campaign had a limited impact on the overall performance of Travel in Q3 FY2020, as the increase in both the number of hotel guests booked and the price per night in October and November contributed to the stable recovery of revenue. However, mainly due to the second state of emergency applied to Tokyo and 91 other prefectures, we expect that the business results of Travel in Q4 FY2020 will decrease significantly.
Q10:
Recovery of revenue in HR Solutions seems very slow. What is the Company's outlook for Q4 FY2020?
A10:
HR Solutions consists of job boards and placement services. TOWNWORK, the job board for part-time workers, showed signs of gradual recovery in October and November. In addition, hiring demand from business clients was steadily recovering in job boards for mid-career professionals such as Rikunabi NEXT. However, hiring demand for part time workers in the dining industry, in particular, has been declining due to shortened business hours for restaurants in response to increasing COVID-19 cases and the second state of emergency applied to Tokyo and 10 other prefectures. Therefore, revenue in the job board business for Q4 is expected to decrease year on year.
In the placement business, although the number of business clients that resumed recruiting and hiring activity has been gradually recovering, a positive leading indicator, it will take some time for revenue to recover. As the placement service operates on a pay-per-hire model in which revenue is recorded when a candidate is hired by a business client, revenue is expected to recover slowly in Q4 FY2020.
Q11:
Why did adjusted EBITDA margin in HR Solutions decrease 2.3pt compared to Q2 FY2020 while Marketing Solutions improved 1.7pt? What is the Company's outlook for HR Solutions's adjusted EBITDA margin for Q4 FY2020?
A11:
Adjusted EBITDA margin for Marketing Solutions improved due to an increase of revenue. In HR Solutions, as the part-time job boards showed signs of a gradual recovery from October to November 2020, HR Solutions partially resumed marketing investments, which had been curtailed during the first half of the year, in an attempt to capture the demand. As a result, adjusted EBITDA margin for Q3 FY2020 decreased 2.3 points compared to Q2 FY2020.
In Q4 FY2020, we expect that hiring demand will be negatively affected by the increased number of COVID-19 cases since December 2020 and the second state of emergency which are applicable to Tokyo and 91 other prefectures. HR Solutions will make strategic marketing investments targeted at the anticipated period of recovery, while controlling its operating costs strategically and flexibly.
Note 1: The Japan government issued a state of emergency to Tokyo and 10 other prefectures in January 2021, but Tochigi prefecture was released as of February 8, 2021.
Staffing
Q12:
Second half guidance of FY2020 was revised for the Staffing SBU. What are the factors behind the revisions for Japan operations and Overseas operations?
A12:
For Japan operations, revenue for the six months ending March 31, 2021, was expected to decrease approximately 10% to 5% year on year due to weak demand for new orders during the first half of the fiscal year which was expected to reduce the number of temporary staff in the second half. However, the outlook for revenue was revised to a decrease of approximately 2.5% year on year, considering the year on year revenue decline in Q3 FY2020 was smaller than expected and, despite the difficulty of predicting the impact of the second state of emergency in Japan, a similar trend is expected for Q4 FY2020.
For Overseas operations, revenue for the six months ending March 31, 2021, was expected to decrease approximately 12% to 8% year on year. The outlook for revenue was revised, considering the gradual recovery of revenue trends supported by strong revenue growth in certain industries. However, due to the ongoing uncertain business environment, it is difficult to expect the same level of recovery in Q4 FY2020. Considering these factors, the outlook for revenue was revised to a decrease of approximately 1.5% year on year.
Q13:
For Japan operations, why did year on year negative growth in revenue worsen compared to Q2 FY2020?
A13:
The year on year growth rate of the number of temporary staff declined in Q3 FY2020 when compared to Q2 FY2020, primarily as a result of a worsening rate of new orders as new demand from business clients remains persistently below prior year levels. Revenue is also expected to decline in Q4 FY 2020 as the total number of temporary staff is expected to continue to be lower than the prior year and due to uncertainty surrounding the state of emergency in Japan and its extension.
Q14:
For Overseas operations, revenue in Q3 FY2020 was almost back to the same level compared to the prior year and improved from the Q2 FY2020 growth rate of -10.2%. What factors led to this recovery and which regions or industries contributed the most?
A14:
Revenue related to logistics roles to support e-commerce and seasonal demand was especially strong in Europe. Additionally, roles closely related to COVID-19 in healthcare and government were a positive factor in many countries. Due to the nature of these drivers, it remains uncertain how sustainable this trend will be in Q4 FY2020 and we will continuously keep an eye on changes in the business environment.
Q15:
The revised adjusted EBITDA guidance implies that there will be increased spending in Q4 FY2020 relative to Q3 FY2020. What is the driver of these costs and why are you making investments in a period of declining revenue?
A15:
Although demand for temporary staff is lower year on year, we are seeing a gradual, if still sporadic, recovery. In order to be best positioned for a sustained recovery in the next fiscal year and beyond, we will increase expenses to improve remote work environments, and increase advertising expenses to attract temporary staff and business clients mainly in Japan.
6. Earnings Materials
Earnings Release, Recorded Audio of Conference call and other related materials can be found here.
Forward-Looking Statements
This document contains forward-looking statements, which reflect the Company's assumptions and outlook for the future and estimates based on information available to the Company and the Company's plans and expectations as of the date of this document or other date indicated. There can be no assurance that the relevant forecasts and other forward-looking statements will be achieved. Please note that significant differences between the forecasts and other forward-looking statements and actual results may arise due to various factors, including changes in economic conditions, changes in individual users' preferences and enterprise clients' needs, competition, changes in the legal and regulatory environment, fluctuations in foreign exchange rates, and other factors. Accordingly, readers are cautioned against placing undue reliance on any such forward-looking statements. The Company has no obligation to update or revise any information contained in this document based on any subsequent developments except as required by applicable law or stock exchange rules and regulations.
Third-Party Information
This document includes information derived from or based on third-party sources, including information about the markets in which the Company operates. These statements are based on statistics and other information from third-party sources as cited herein, and the Company has not independently verified and cannot assure the accuracy or completeness of any information derived from or based on third-party sources.